India's decade of disparity: A deep dive into NASA's latest poverty index
NASA's Socioeconomic Data and Applications Center (SEDAC) recently launched the GRDI. This tool gauges global poverty levels at a detailed 1 km resolution.

GRDI isn't just numbers — it's about real lives, aspirations, and challenges.

New Delhi,UPDATED: Aug 18, 2023 17:26 IST
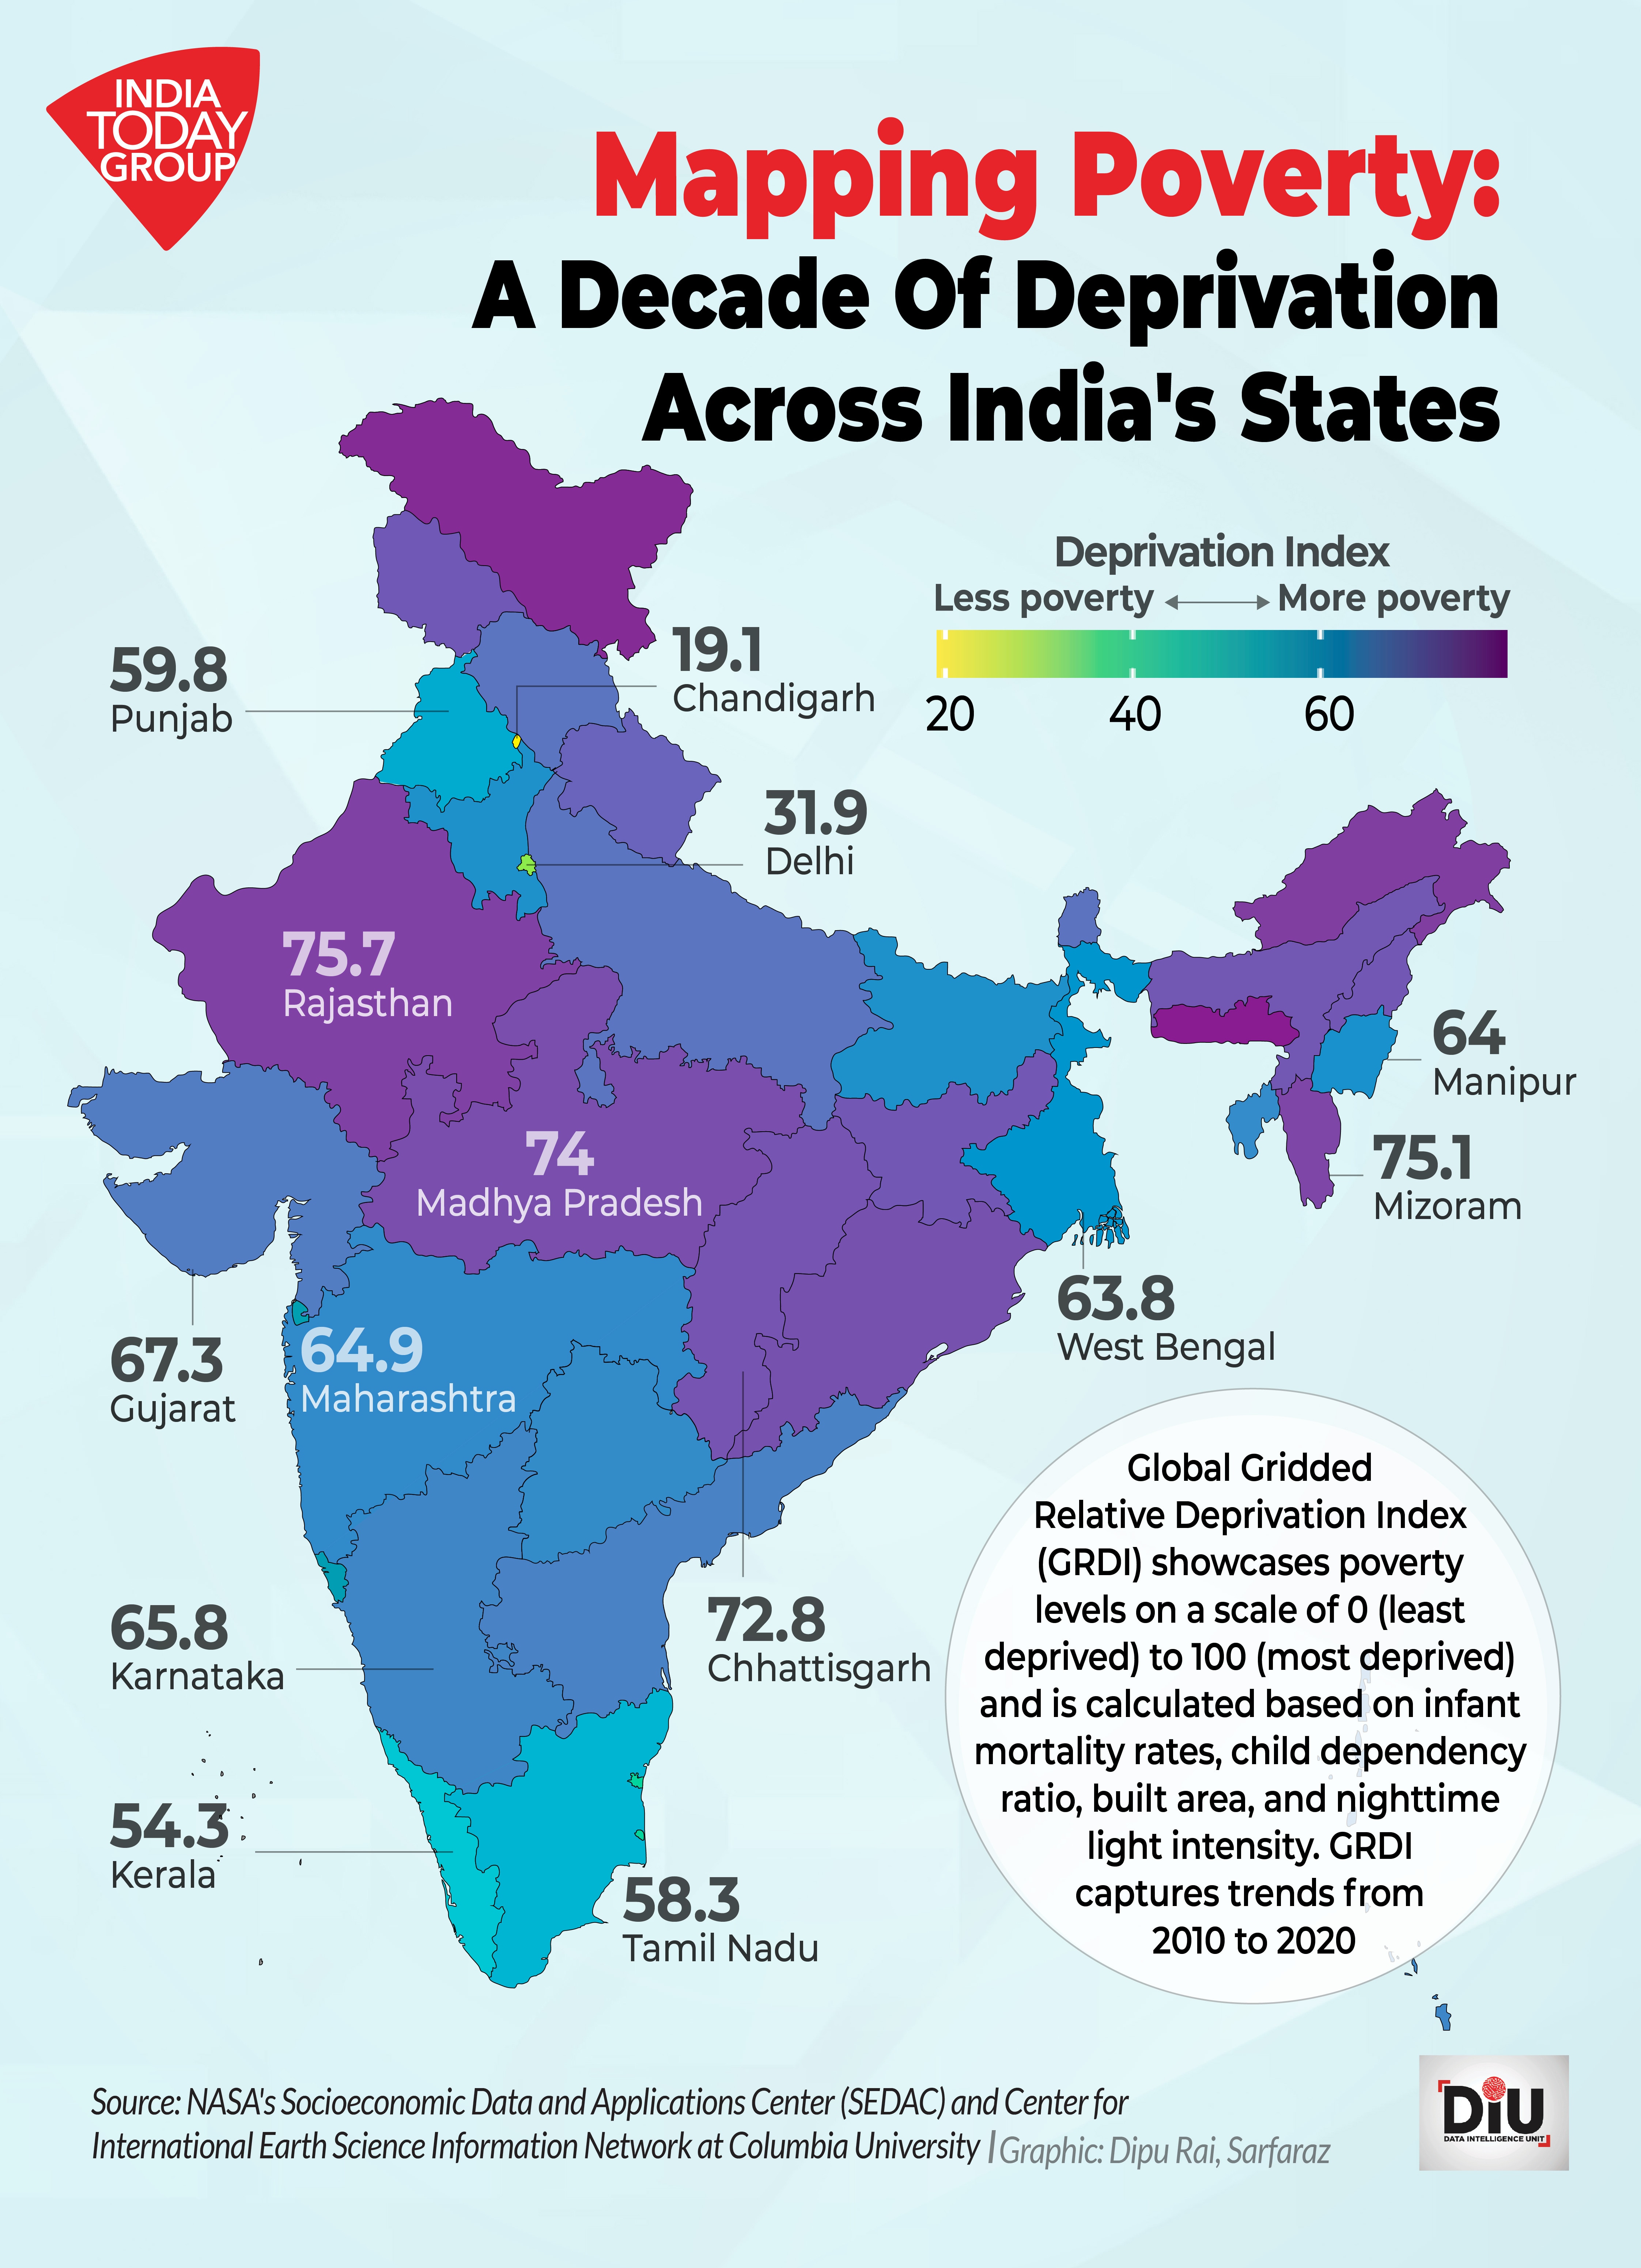
India's overall socioeconomic growth over the past decade hides sharp contrasts among different states. NASA's Global Gridded Relative Deprivation Index (GRDI), a measure capturing poverty, health, education, satellite imagery, and more, exposes these stark regional differences.
- The poll-bound states of Rajasthan, Madhya Pradesh, Chhattisgarh, and Mizoram exhibit GRDI higher than the national average, indicating low standards of living
- Meghalaya has the highest GRDI at 79.8, indicating severe deprivation despite its natural bounties
- Union territories Chandigarh and Delhi sit at a mere 19.1 and 31.9, reflecting relatively higher living standards
advertisement
WHY IT MATTERS?
NASA's Socioeconomic Data and Applications Center (SEDAC) recently launched the GRDI. This tool gauges global poverty levels at a detailed 1 km resolution. A score of 100 indicates extreme deprivation, while zero denotes minimal. The data blends human development metrics with satellite imagery, including night-time lights, offering a more precise view than traditional census data.
A TALE OF 2 EXTREMES
While the national average GRDI hovers around 64.4, individual values for states and union territories reveal the nation's varied fabric. The latest GRDI data for Indian states and union territories paints a picture of contrasts:
Four states that are scheduled to go to the polls later this year have GRDI much higher than the national average. Chhattisgarh has a GRDI of 72.8, Madhya Pradesh 74, Rajasthan 75.7, and Mizoram 75.1. GRDI values surpassing 70 suggest pressing developmental challenges in these areas.
Meghalaya, known for its lush rainforests and picturesque landscapes, tops the list with the highest GRDI value of 79.8. Despite its natural wealth, the state faces significant challenges in access to essential services, income levels, and other well-being metrics.
Chandigarh is at the other end of the spectrum, with a GRDI of 19.1 only. A hub of modernity and progress, Chandigarh's low GRDI underscores its residents' relatively high living standards. Delhi, Kerala, Tamil Nadu, Puducherry, Punjab and Goa, with GRDI values below 60, also reflect better living standards and access to essential services.

THE BIG PICTURE
In September 2022, the World Bank revised its threshold for global extreme poverty from $1.90 to $2.15 daily per individual. The institution posits that those subsisting on less than this updated amount are in extreme poverty. As per 2019 data, this condition affects approximately 648 million individuals worldwide.
According to the Poverty and Shared Prosperity Report (2022), almost 40 per cent of individuals facing multidimensional poverty elude monetary poverty surveys. The World Bank created the Multidimensional Poverty Measure to capture them.
THE BOTTOM LINE
GRDI isn't just numbers — it's about real lives, aspirations, and challenges. For India, the next step is not just growth but inclusive growth. GRDI is also unique because it uses data from 2010 to 2020, showing long-term trends in deprivation.
HOW IS GRDI CALCULATED?
Here are the six components used to determine the degree of relative poverty in the final index:
- Child Dependency Ratio: Quantifies the ratio of children (0-14 years) to the working-age populace (15-64 years). It measures the balance between young and working-age populations. A higher ratio indicates a younger, burgeoning population.
- Infant Mortality Rates: Represents fatalities in infants under a year per 1,000 live births within that year. Acts as a health barometer, where higher rates hint at pronounced deprivation and health challenges.
- Subnational Human Development Index: Assesses overall human well-being through education, health, and living standards. A lower index points towards areas with increased challenges in human development.
- Built Area: Examines the ratio of developed to undeveloped areas, indicating urbanisation rates and infrastructure development. A lower ratio suggests a region may face challenges often associated with rural areas.
- VIIRS Night-time Lights Intensity: Uses night luminosity as a proxy for economic activity and development. Dimmer regions typically align with areas facing economic hardships.
- VIIRS Night-time Lights Slope: Observes changes in night-time luminosity over nearly a decade. A declining brightness can signify waning economic activity and increasing deprivation.